As I mentioned in a previous post, there are 3 main ways to debug or trace in the IPC. This second method is probably the easiest method, but comes with limitations (doesn’t everything 🙂 ). IPC Tracing using IPC UI is very useful and very simple to see what’s happening within your configuration.
Step one is to activate the tracing functionality.
The IPC UI has a built in functionality to display engine traces. In order to active these engine traces, you have to turn on the following switch in the XCM Administrator:
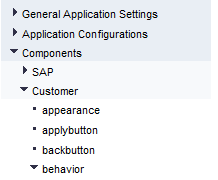
Select or create a specific component configuration for Behavior.
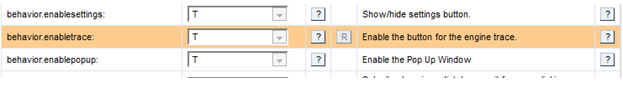
The option behavior.enabletrace is by default off (“F”) and has to be turned on (“T”).
Once traces have been activated, there is a new option in the menu “Trace UI”.
![]()
The trace settings can be specified on the following screen:
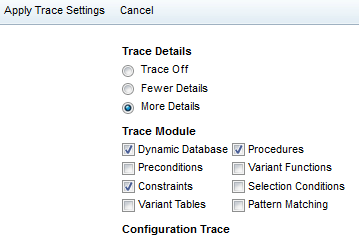
The modules are the same as in SCE, see Table 1 “traceable engine modules” .
Activate the traces by clicking “Apply Trace Settings” in the top menu.
This brings you back to the configuration UI, now click on Trace UI again and you will see a trace similar what was shown in the COM_CFG_SUPPORT.
Now, I mentioned a downside to this approach. That downside is that it’s impossible to ever see the initialization of your characteristics and values. You can see what happens when things change, but not the values that get set upon entering the configuration, like reference cstics. For any development environment, I still highly encourage this setting to be turned on.
thanks for reading,