Well, a while back, I did some posts about different ways to debug in the IPC. THere was one more way that I never talked about, mostly because I hadn’t been able to get it working on my machine. Using the SCE Debug as a tool is a great way to test your models on a local machine. While it won’t contain all the same information as doing it online, it does give you the opportunity to play with your model without being connected to SAP or even the internet.
The modeling happens in R/3 as usual. If something is to be tested in IPC, a runtime version has to be created. This is of course the same pre-requisite for the IPC running in VMC of ECC. However instead of calling the report to publish the runtime version to VMC’s DB, you download it, using transaction CU36. It will download the whole KB into flat files. The flatfiles will then be imported into a (local) database. This process is executed by a simple batch file. After the flatfiles are imported, the RTV is available to SCE. For more information on this, see my previous posts.
Select from the menu Trace–>Trace Settings.
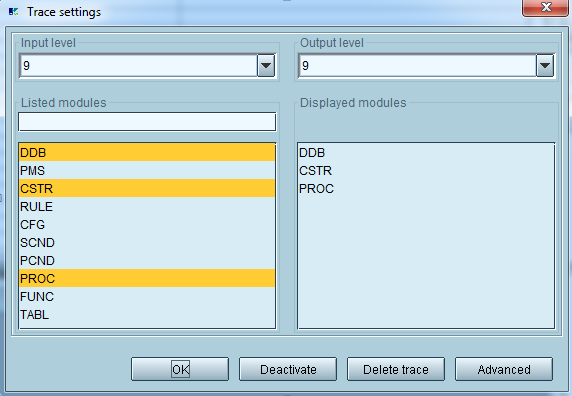
In the dialog you can select an appropriate input level for filtering out some details (if wanted). 9 will show everything, which makes sense for a trace.
Select from the list of modules, for what you want to receive log entries. They are as follows:
| Module | Description |
| DDB | Dynamic Database. This is the memory of the inferencing engine, storing all facts about the current configuration state. |
| PMS | Pattern Matching System. Constraints are considered declarative. This means in opposite to procedural coding where everything is executed line by line, constraints describe a status and will be executed in any undefined order if their pattern is fulfilled. The pattern usually exists of an object declaration as well as a condition. The pattern matching system is responsible to find those constraints, which patterns are fulfilled. |
| CSTR | Constraint. This is useful for figuring out for example in combination with DDB, how a constraint influences facts. |
| RULE | Rules. (If used) Mainly used in Advanced mode as monitoring rules |
| CFG | Configuration |
| SCND | Selection condition (good for troubleshooting existence or missing items on a bom explosion). See super bom. |
| PCND | Precondition. If used. It is strongly recommended not to use any preconditions. |
| PROC | Procedures. This option makes most sense in combination with DDB, seeing which modifications happen. |
| FUNC | Functions |
| TABL | Variant Table access |
Table 1 “traceable engine modules”
Very typical and useful settings are DDB,CSTR,PROC. Eventually SCND if the bom explosion is to be verified.
After selecting the options, you can do any modification directly in the SCE UI. With each selection / modification, you see traces being updated in the lower part of the window:
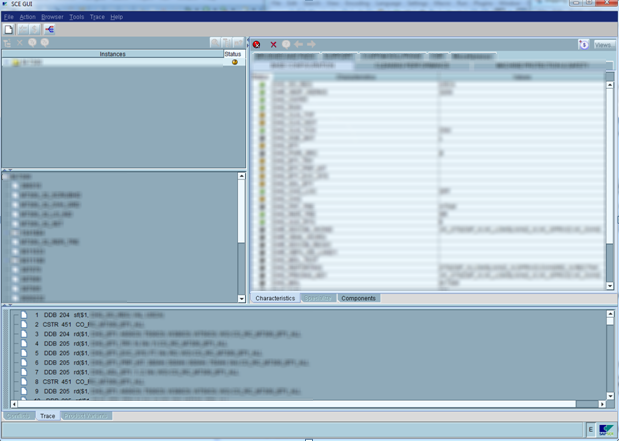
The trace area is not very powerful regarding functionality like search etc. The right click menu allows to clear or to save it to a file. It is however possible to select all entries with ctrl + A, copy the traces (ctrl + C) and paste them into an external editor, such as notepad++.
One of the biggest benefits of using the SCE over using IPC is if you want to see the initial logic being executed, you activate the trace and create a new configuration session (with the white paper icon in sce). The IPC will automatically execute the initial logging before you can begin the simple trace, so often this will help you find problems within the initial execution of your dependencies.
As always, Thanks for reading,